 Deutsch
 English
CANopen Magic now with charting of CANopen Data Objects
The popular CANopen Analysis software CANopen Magic and CANopen Logxaminer by Embedded Systems Academy have received a major update. The latest enhancement is a charting module that draws process data plots over time. In CANopen Magic, the data is captured from a live CANopen system whereas in CANopen Logxaminer it is done in post-analysis from a trace recording.
The process data charts are updated dynamically with each corresponding PDO, SDO or USDO on the network. A broad selection of triggering, filtering, scaling and measurement options allow to fine-tune the charts to the task at hand. Configurable colours and shading for each data source complete the customization options.
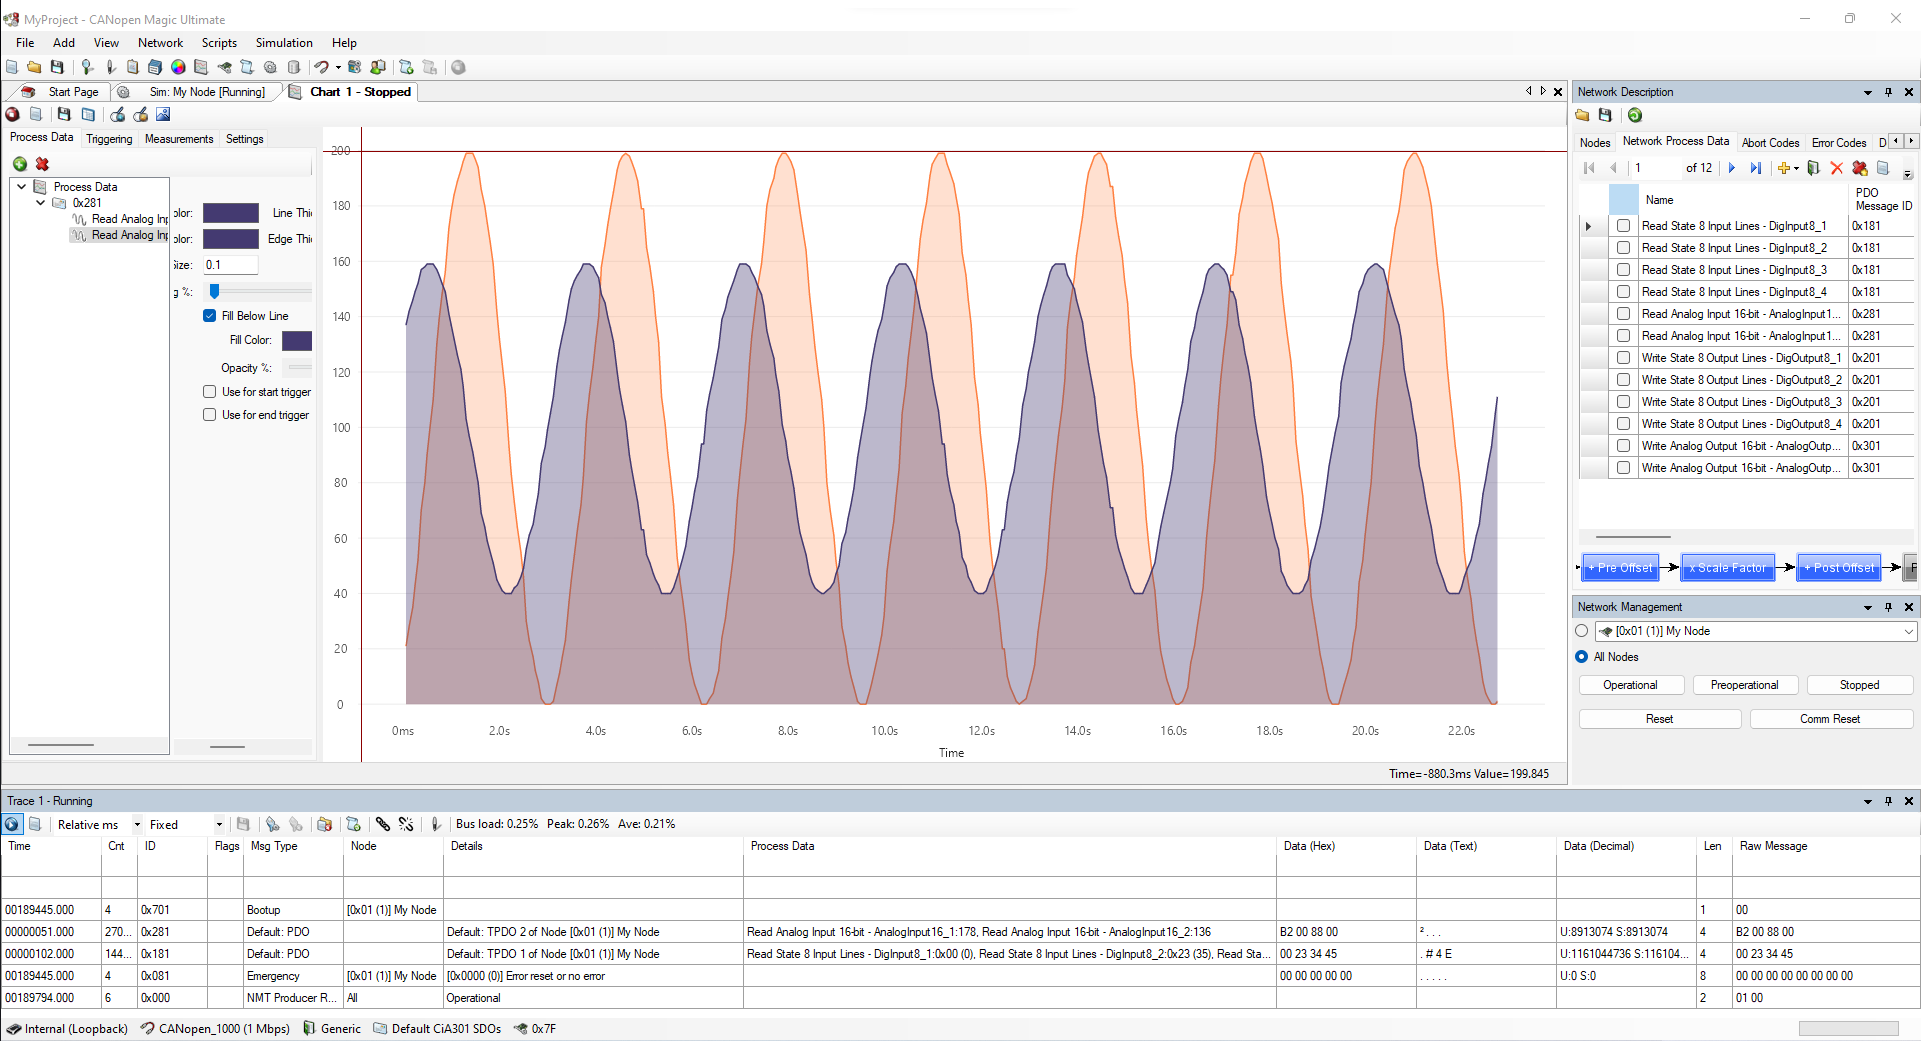
CANopen Magic generates process data information automatically from the EDS (Electronic Datasheet Files) files of the CANopen nodes connected to the network, making setting up charts from process data easy.
In summary, the added charting module significantly improves the build-in data analysis capabilities of CANopen Magic and CANopen Logxaminer. The charting module is now available in the CANopen Magic Professional and Ultimate editions. Get your trial here: Try CANopen Magic!


 Embedded Networking with CAN and CANopen. Your technology guide for implementing CANopen devices.
 Implementing scalable CAN security. Authentication and encryption for higher layer protocols, CAN and CAN-FD